Particle size analysis is a technique used to determine the distribution of particle sizes in a given sample, commonly applied in fields like geology, soil science, pharmaceuticals, and materials engineering. The results help identify the physical and chemical properties of materials, which can impact processes such as flowability, reactivity, strength, and packing density.
The particle size distribution is often represented graphically as a grading curve, which plots the cumulative percentage of particles passing each sieve size, providing insights into the material’s properties, such as its compactness, permeability, and shear strength.
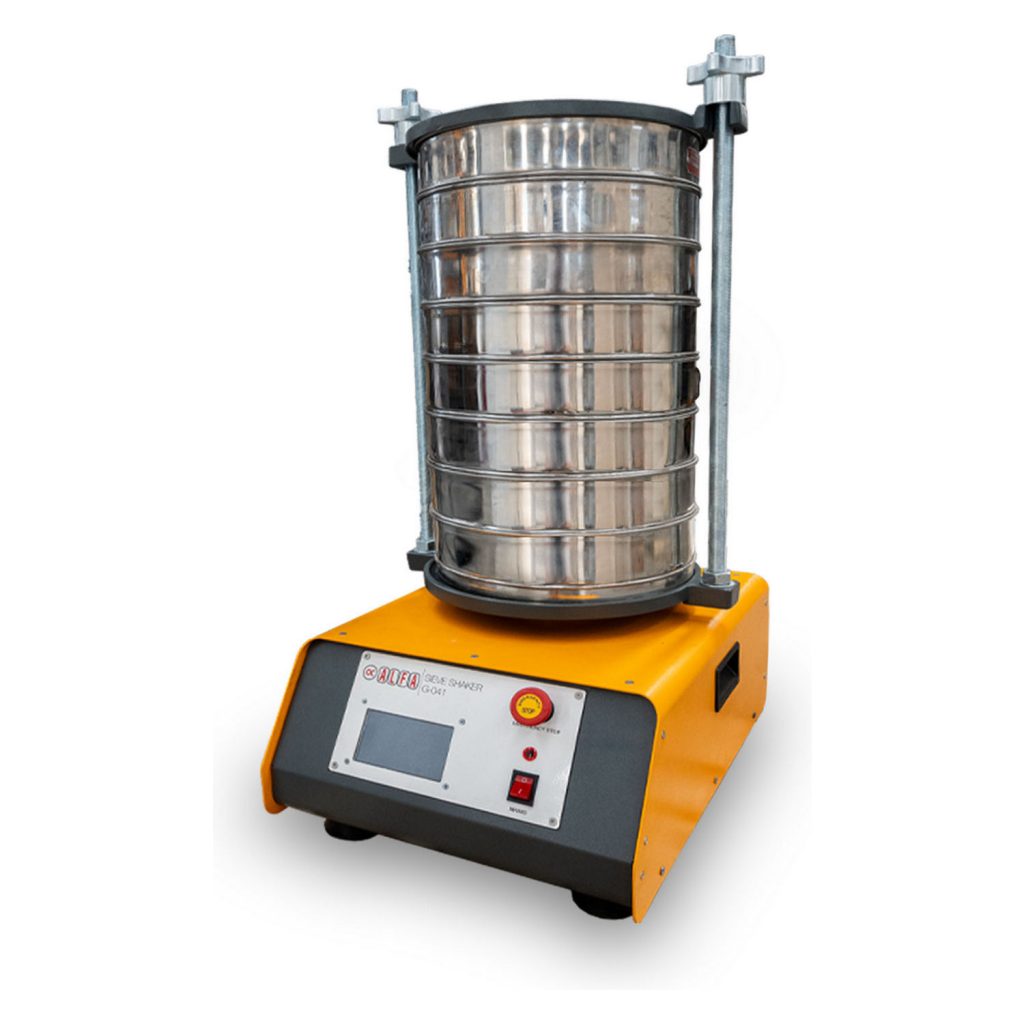
Sieve Analysis:
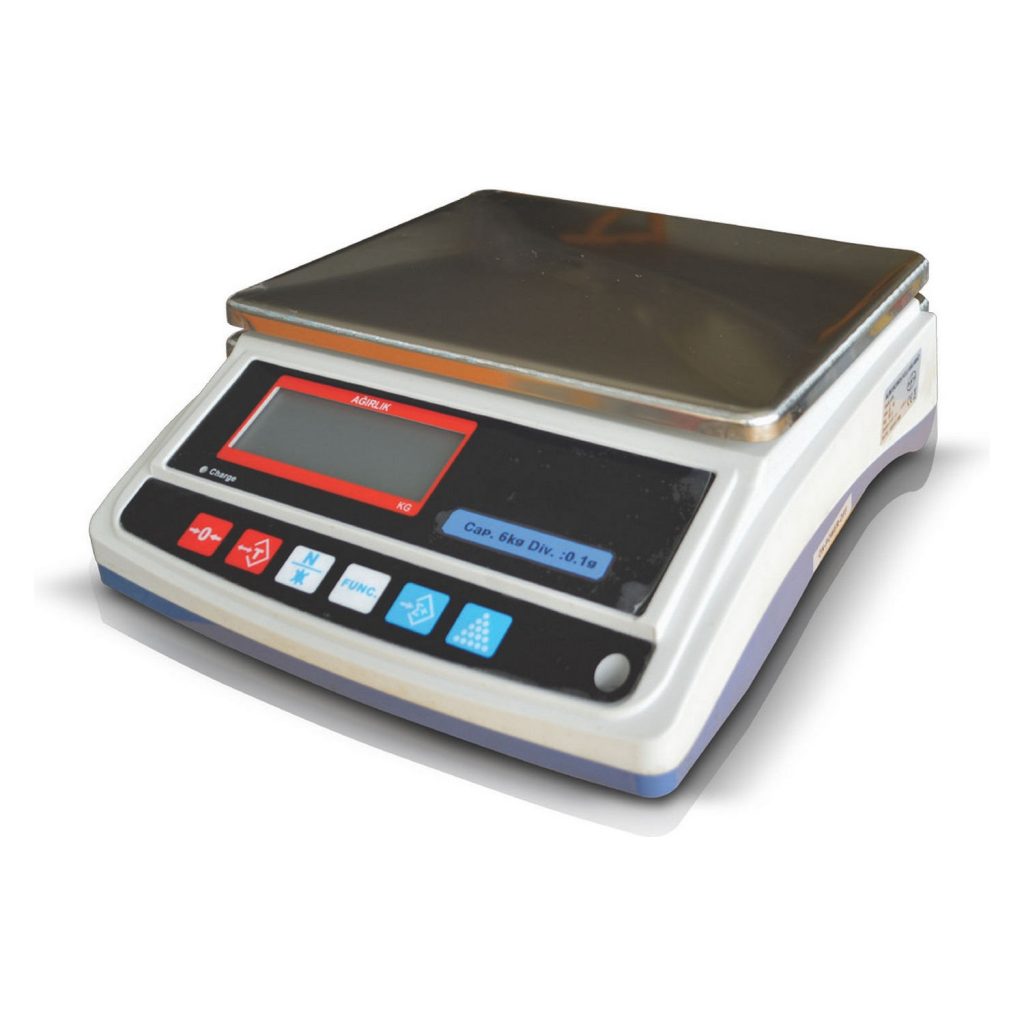
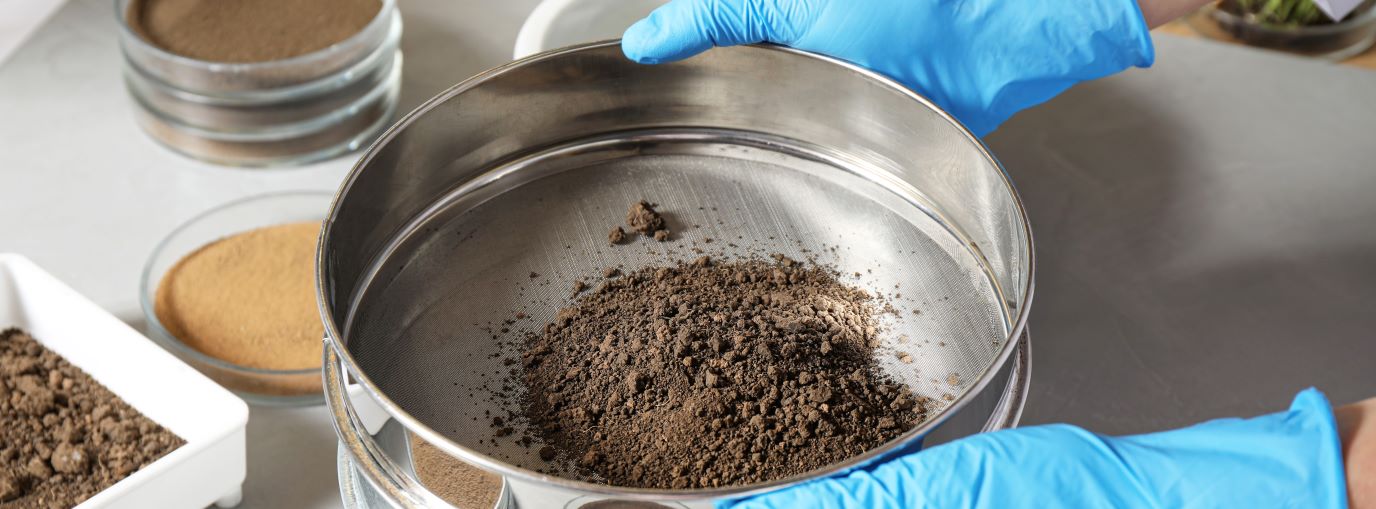
- This method uses a stack of sieves with decreasing mesh sizes to separate particles by size. The sample is placed on the top sieve, and the stack is vibrated or agitated. Particles pass through each successive sieve based on size, with finer particles reaching the lower sieves. The retained weight on each sieve is then measured to determine the size distribution.
- Commonly used for larger particles (down to about 0.075 mm).
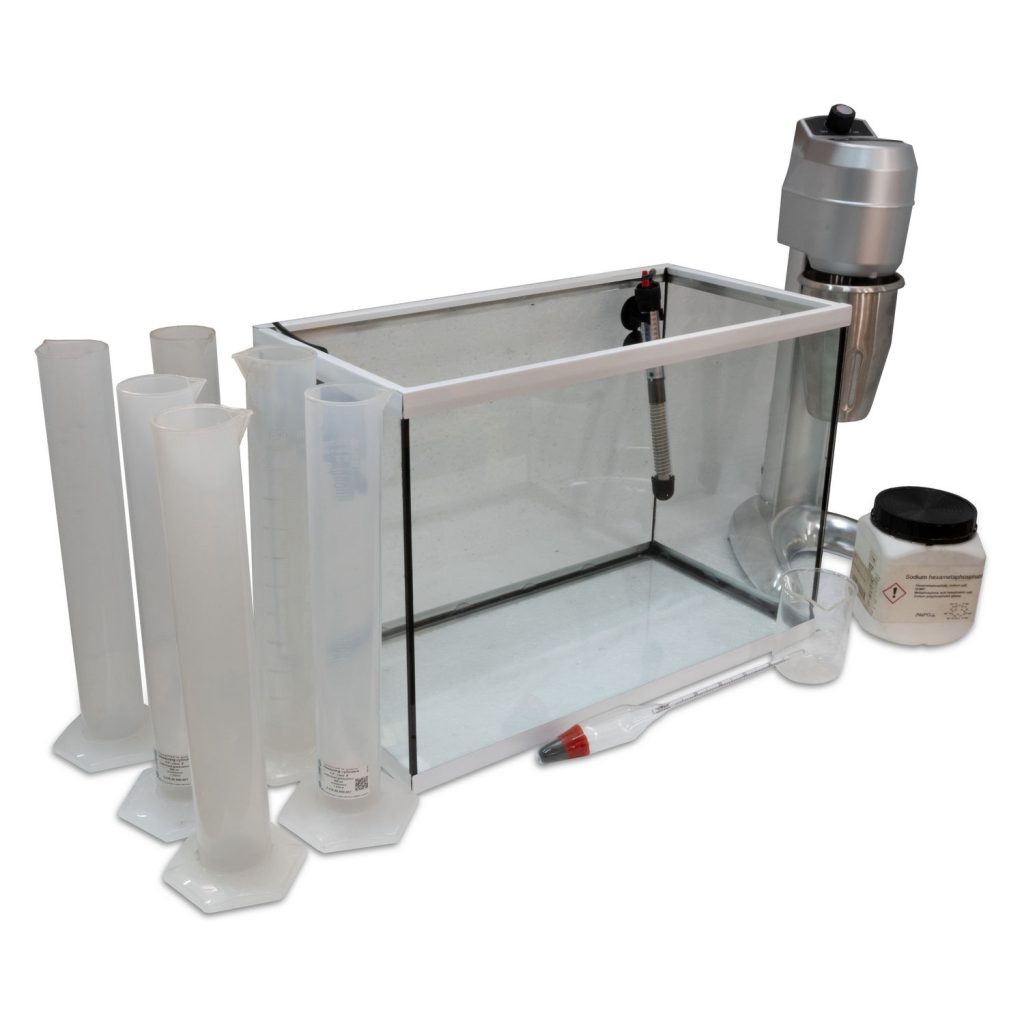
Sedimentation Analysis (Hydrometer Method):
- Based on the principle of Stokes’ Law, this method involves measuring the rate at which particles settle in a fluid. The larger particles settle faster, while smaller ones take longer. A hydrometer or pipette can be used to measure sedimentation rates.
- Often used in soil and sediment analysis to distinguish between sand, silt, and clay fractions.
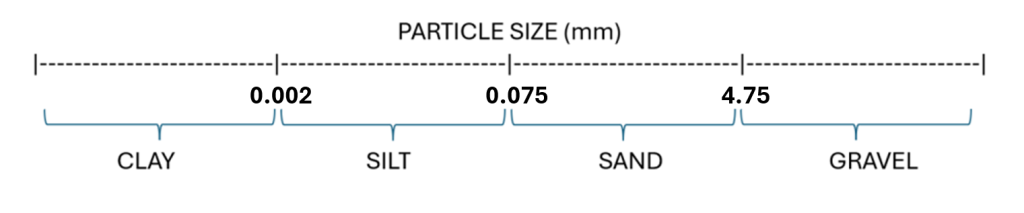
SAND / GRAVEL Threshold:
- (4.75 mm) is the common limit that divides “gravel” from “sand” in many engineering standards, like the Unified Soil Classification System (USCS) and the American Association of State Highway and Transportation Officials (AASHTO). According to these systems, particles larger than 4.75 mm are classified as gravel, while those smaller than 4.75 mm are classified as sand.
- (2 mm) is another threshold, often used in soil science and geology. In this context, particles smaller than 2 mm are considered sand, while particles larger than 2 mm may be classified as gravel.
Particle Size Analysis Software by ALFA
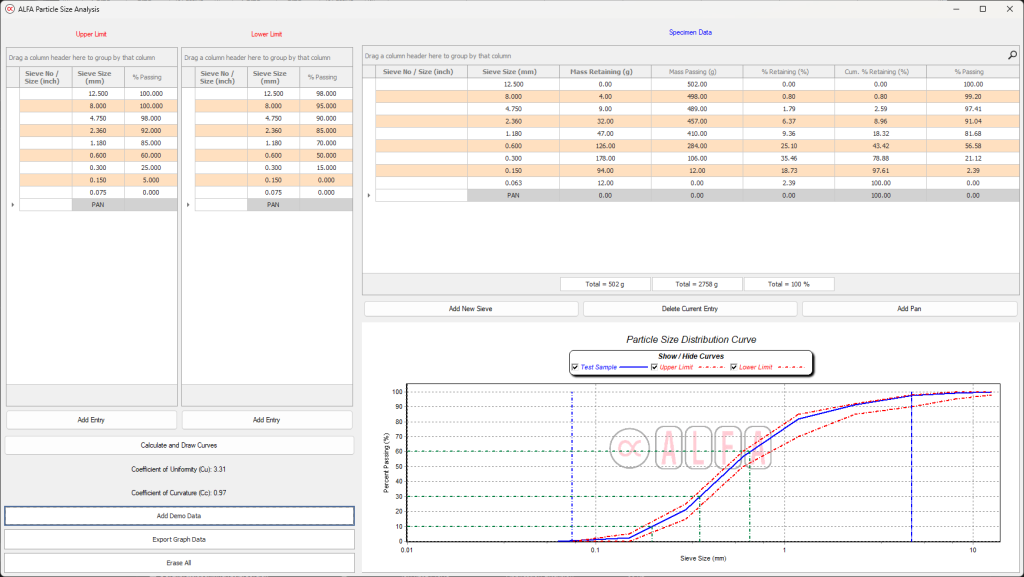
ALFA’s advanced software offers a straightforward and efficient solution for plotting particle size distribution curves. Key features include:
- Plotting the primary Particle Size Distribution curve
- Displaying upper and lower limits to easily spot missing or excess particle sizes
- Segmenting the distribution into Clay, Silt, Sand, and Gravel zones based on the input data
- Identifying D60, D30, and D10 values and calculating the Coefficient of Curvature (Cc) and Coefficient of Uniformity (Cu)
Particle Size Analysis from Geotechnical Point of View
The particle size distribution (PSD) curve from particle size analysis provides a wealth of information about soil characteristics. Key aspects derived from this curve include soil classification, gradation, and specific coefficients like the coefficient of uniformity and coefficient of curvature. Here’s a breakdown of these features:
1. Soil Classification (According to USCS and AASHTO)
- Soil classification involves categorizing soil based on its grain size distribution. The Unified Soil Classification System (USCS) and the American Association of State Highway and Transportation Officials (AASHTO) classification systems are common in engineering.
- Coarse-Grained Soils: If more than 50% of soil particles are retained on the No. 200 sieve (0.075 mm), the soil is classified as coarse-grained. Coarse-grained soils are further divided into:
- Gravel (larger than 4.75 mm)
- Sand (between 0.075 mm and 4.75 mm)
- Fine-Grained Soils: If more than 50% of the soil passes the No. 200 sieve, it is classified as fine-grained. Fine-grained soils include:
- Silt and Clay, which are further distinguished by plasticity tests (e.g., Atterberg limits).
- The PSD curve helps identify the soil type based on the percentage of gravel, sand, silt, and clay, crucial for predicting its engineering behavior, such as permeability and compressibility.
2. Gradation (Well-Graded vs. Poorly Graded)
- Gradation describes the distribution of particle sizes within the soil.
- Well-Graded Soil: Contains a wide range of particle sizes, with a more even distribution across the sizes. These soils typically have better compaction and strength characteristics.
- Poorly Graded Soil: Contains particles predominantly of one size (uniformly graded) or has gaps between particle sizes (gap-graded). These soils are often weaker and less stable under load.
- The shape and slope of the PSD curve help determine whether a soil is well-graded or poorly graded.
3. Coefficient of Uniformity (Cu)
- The coefficient of uniformity (Cu) is a measure of the range of particle sizes in the soil and is given by:
- Here, (D60) is the particle diameter at which 60% of the sample’s weight is finer, and (D_{10}) is the diameter at which 10% of the sample is finer.
- Cu Interpretation:
- If (Cu > 4) for gravel and (Cu > 6) for sand, the soil is typically considered well-graded.
- Low (Cu) values indicate a narrow range of particle sizes (uniform grading).
4. Coefficient of Curvature (Cc)
- The coefficient of curvature (Cc) provides additional insight into the soil’s gradation and is calculated as:
- Where (D30) is the particle size at which 30% of the soil sample is finer.
- Cc Interpretation:
- For well-graded soils, (Cc) typically falls between 1 and 3.
- Values outside this range suggest poorly graded soil, either uniform or gap-graded.
5. Understanding Soil Behavior and Engineering Properties
- Permeability: Coarse, well-graded soils (gravelly sands) tend to have higher permeability than fine-grained or uniformly graded soils.
- Compaction and Strength: Well-graded soils compact more effectively and can achieve higher densities, contributing to greater load-bearing capacity. Uniformly graded or gap-graded soils often have lower compaction and strength potential.
- Stability and Suitability for Construction: The gradation curve helps engineers decide on the suitability of soil for foundations, embankments, and other structures. For example, well-graded soils are often preferred for subgrade construction due to their stability.
6. Other Classification Parameters
- The PSD curve, combined with Atterberg limits, can classify fine-grained soils (silt and clay) and differentiate between cohesive (clay-like) and non-cohesive (silty) materials.
- By interpreting these parameters, engineers can make informed decisions about soil modification, stabilization, and suitability for construction or agricultural use.
In summary, the PSD curve and related coefficients provide a comprehensive analysis of soil properties, assisting engineers in understanding its compaction potential, stability, permeability, and general suitability for various applications.